This document describes the main features of the UISPIN Charts component library. UISPIN is an RDF-based language for describing user interfaces. Among others, UISPIN makes it easy to develop new kinds of user interface components. The UISPIN charts library provides standard components for common visualizations including pie charts, bar charts, and various kinds of maps.
Work in progress, first beta release: March 2010
This document is part of the UISPIN Specification.
UISPIN makes it easy to develop new components that can be used like HTML tags in a document. Those components may comprise of a complex snippet of HTML and other XML-based languages such as SVG. UISPIN components can be published on the web, where they are identified by their URI. UISPIN Charts is a library of reusable components for visualizing data on charts and maps.
In order to use any of the components described in this document, users
just need to import the namespace http://uispin.org/charts.
Then it is possible to use the additional tags and feed them with data
in the current context.
The classes are self-describing and define their individual arguments.
With a bit of UISPIN experience, it should therefore be straight-forward
to use the chart components in your own applications.
Most of the chart components take a SPARQL SELECT query (or result set) as their input arguments. Those SELECT queries basically produce tabular data, and many types of charts expect tabular data as their input.
Note that the UISPIN Charts library is still under development, at a rather early stage. You should not rely on them yet as their interface may change without notice with future updates.
This section describes the available chart components from the UISPIN Charts library. The default implementation of those components is based on the Google Charts API. This means that the charts are rendered into HTML images that are dynamically loaded from the web.
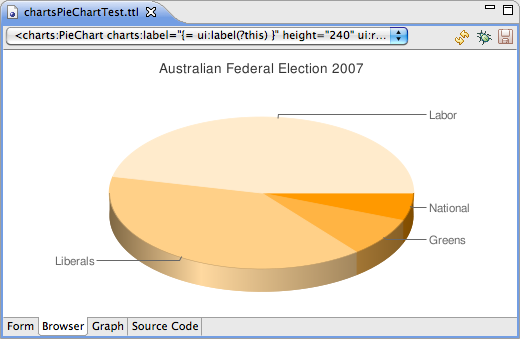
An example pie charts is shown in the following screenshot.
The following image shows the example ontology that the pie charts has been created for.
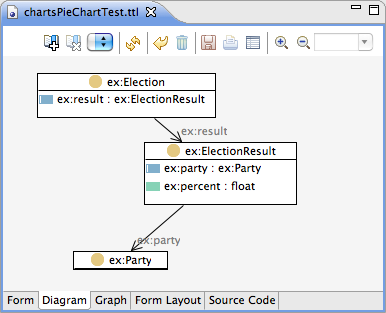
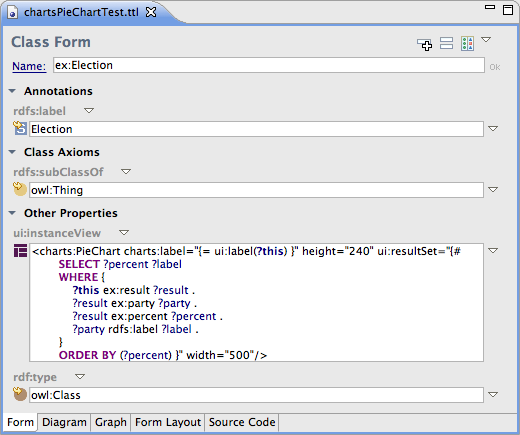
In this example, the class ex:Election has an associated
ui:instanceView that contains an instance of
charts:PieChart as shown below.
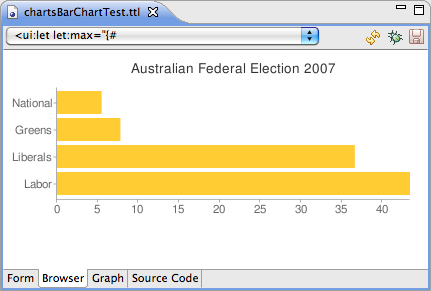
The following screenshot shows a bar chart for the same election data from the previous section.
Map charts display the countries of the world, with color coding representing values for the individual countries.
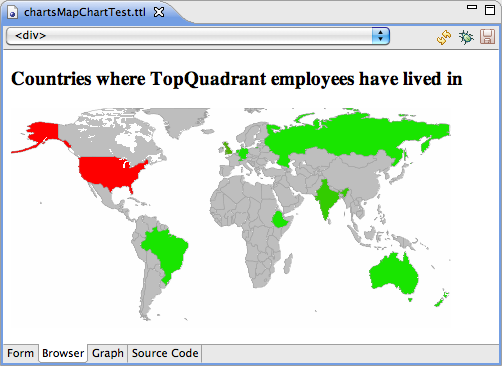
This section describes the available map components from the UISPIN Charts library.
The default implementation of those components is based on the
Google Maps API.
In order to use those features, UISPIN users need to set a
system preference
called GoogleMapsAPIKey to store the local Google API key.
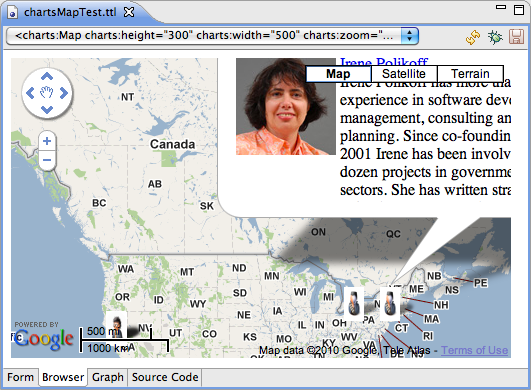
The charts:Map component can be used to insert a fully functional
Google Map into a web page.
The map may contain a collection of markers, and for each marker it is possible
to specify latitude, longitude, an icon and the resource that is being represented
by the marker.
As shown in the image below, a click on the marker may even reveal a summary
view for the underlying resources.
Static maps are a simplified version of (interactive) Google Maps, that are best suited for screen shots and pages that do not require a rich interface.
The URL of the UISPIN Charts Schema is http://uispin.org/charts